
In this graph, you will see the different categories of motor vehicle accidents that occurred in Denver in 2022, such as bicycle, pedestrian incidents, and neighborhood accidents. Each incident is also categorized by severity, including fatal accidents, serious injuries, and minor injuries. Additionally, the data also indicates whether the accident was reported or not. This comprehensive visualization will helps better understand the frequency and types of accidents that occurred in Denver at the time.
I believe that this data has surfaced from the Denver police departments, or the department of motor vehicles which demonstrates and collects these datasets and assembles them. It was data that is from different areas within Denver, and was collected through multiple approaches of regular ticketing or reports. Data like this is very important to hold on to and visualized so that people better understand the importance of safety with motor vehicles.
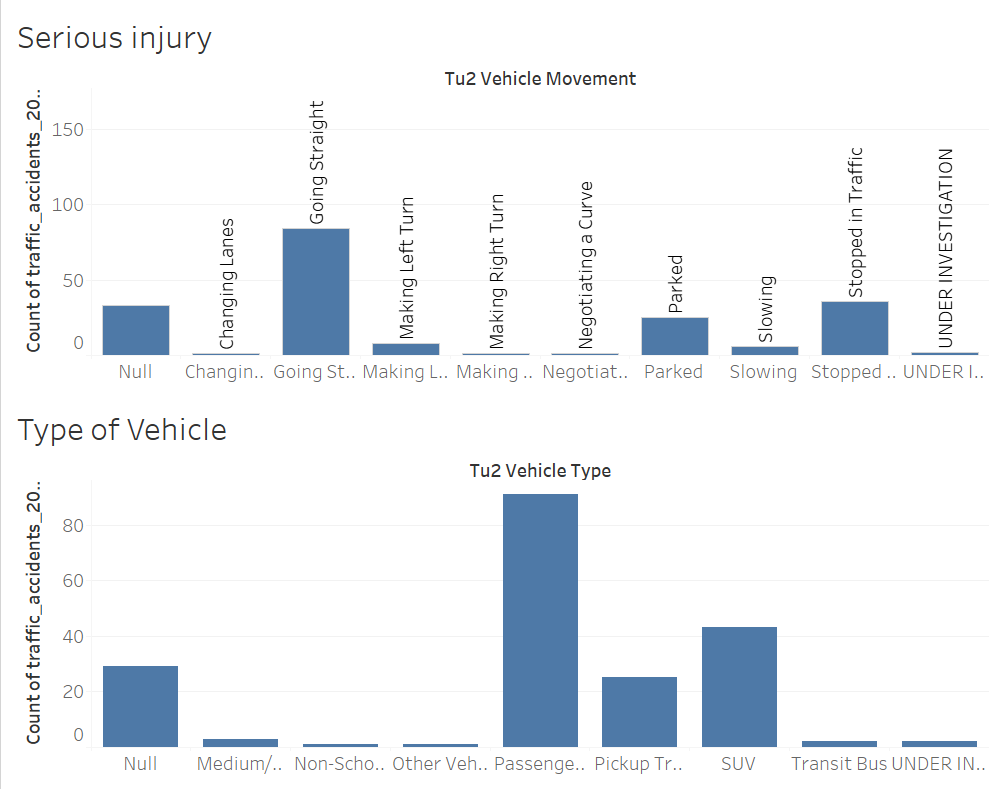
The data presented in these graphs provides valuable insights into factors that contribute to incidents and serious injuries for drivers across different vehicle types. In the first graph, we see that going straight and stopped in traffic are involved in the most incidents, while under investigation and right turns are involved in the fewest. Meanwhile, the second graph highlights medium sized cars and SUVs as particularly risky behaviors that result in a higher number of serious injuries. By understanding these differences in incident frequency and injury risk, we can work towards solutions that address the unique challenges faced by different types of drivers and vehicle operators.